 |
 |
Issue No. 20 Spring
|
|
ENS News |
|
ENS Events |
|
Member Societies & Corporate Members |
|
Taming the Chernobyl Avalanche IAEA presents results of OSART Mission The Advanced Reactor Group (GRA) Calculation of the neutron flux, fuel and moderator temperature transients for Research Reactors |
YGN Report |
|
European Institutions |
|
ENS World News |
ENS Members |
| Links to ENS Member
Societies Links to ENS Corporate Members Editorial staff ______________________ |
| _____________________ |
 |
____________________ |
 |
____________________ |
|
|
|
t |
time (sec) |
N |
neutron flux (proportional to the reactor power) |
|
change of the effective neutron multiplication factor (keff) |
ß |
sum of the delayed neutron fractions (here 0.006502) |
ß i |
the i:th delayed neutron fraction |
l |
neutron mean lifetime (here 0.001 sec) |
|
i:th decay constant (sec-1) |
ci |
concentration of the i:th fraction of the delayed neutrons’ precursors, |
At |
steady state, when time is zero t=0 all time derivatives are equal to zero, |
all |
d/dt=0 and the initial value of the relative power equals
unity N(0)=1, and also no reactivity perturbation is present |

Delayed neutron data for thermal fission in U235 is used
Group |
1 |
2 |
3 |
4 |
5 |
6 |
Fraction ßi |
0.000215 | 0.001424 | 0.001274 | 0.002568 | 0.000748 | 0.000273 |
Decay constant |
0.0124 |
0.0305 |
0.111 |
0.301 |
1.14 |
3.01 |
The initial values of the delayed neutrons’ precursors are;
i |
1 |
2 |
3 |
4 |
5 |
6 |
ci(0) |
17.3387 |
46.6885 |
11.4775 |
8.5316 |
0.6561 |
0.0907 |
4. Using the MATLAB notations
x(1)=N x(2)=c1………… x(7)=c6
the code is
%Save as xprim7A.m
function xprim =xprim7A(t,x,i)
DeltaK=i*0.010*0.50; %voidcoef=i*0.010pcm/percent
void change, void increase 50percent
xprim=[(DeltaK/0.001-6.502)*x(1)+0.0124*x(2)+0.0305*x(3)+0.111*x(4)+0.301*x(5)+1.14*x(6)+3.01*x(7);
0.2150*x(1)-0.0124*x(2);
1.4240*x(1)-0.0305*x(3);
1.2740*x(1)-0.1110*x(4);
2.5680*x(1)-0.3010*x(5);
0.7480*x(1)-1.1400*x(6);
0.2730*x(1)-3.0100*x(7)];
To study the importance of the magnitude of the void coefficient,
it is enough to plot the first colon of the x matrix. The rows
of the x matrix are the time steps.
%Save as ReaktorKinA.m
figure
hold on
for i=0:1:3
[t,x]=ode45(@xprim7A,[0 0.2],[1; 17.3387; 46.6885; 11.4775; 8.5316;
0.6561; 0.0907],[] ,i);
plot(t,x(:,1))
end
hold off
5. The result
Is given in the following plot;

Figure2. Power Increase at the Insertion of 50% Void at Different
Void Coefficients
6. Block diagram
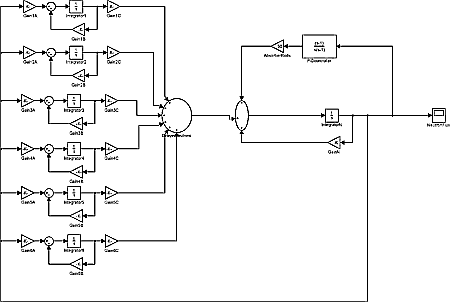
Using the same parameters a block diagram is created here with SIMULINK
Delayed group 1
Gain1A = 0.2150 Gain1B = 0.0124 Gain1C = 0 0.0124 Integrator1
= 17.3387 (is the initial value of the first delayed group)
Delayed group 2
Gain 2A = …………………….
GainN = -1.502 [= 6.502 – 5 (= the void reactivity perturbation)]
IntegratorN = 1 (is the initial value of N)
The controller is represented with a zero pole block; (s – 1)/s(s – 1)
Here are the; zeros: [1], poles: [0 1], gain: [1]
Here the absorber rods are represented with an amplifier, the
gain is 50
Figure 3. Block diagram of the neutron kinetics (with six delayed groups) and the automatic control system with a PID (Proportional and Integrating “1/s” and Differentiating “s”) controller
In this case study, a 10 % pcm/% void coefficient is used and the perturbation is as earlier, a50% void increase. The system response without an automatic control system is like an avalanche

Figure 4. System response without an effective automatic control
system.
Relative neutron flux (Power) vs. time (sec)
There is of course no construction which can take a 500 times power increase in 10 seconds. During the Chernobyl accident the result was a disaster with an elapsed time much less than 10 sec.
7. Automatic control
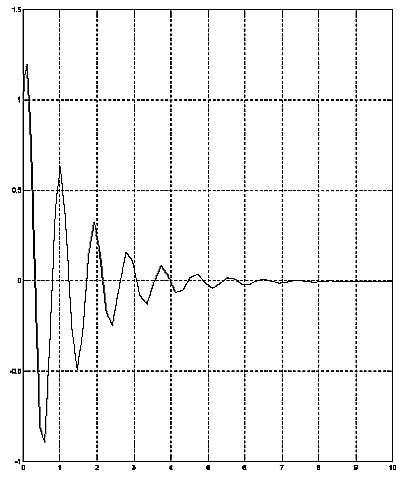
In theory one can specify a control system and a connected absorber rod actuator to team this transient. To achieve this, the control action must be extremely fast and must start effectively within a fraction of a second. However, to realize a mechanical absorber rod operating device with the required speed is very difficult. For this example a PID controller is chosen and the absorber rods are represented with an amplifier which follows the output of the controller. The result is quit reasonable.

Figure 5. System response with an automatic control system (PID).
Relative neutron flux (Power) vs. time (sec)
The Chernobyl disaster demands many analyses to really understand what happened there and how to avoid anything similar in the future. This article is one such analysis.
8. References
University textbooks on nuclear engineering contain the applied equations. Textbooks on information technology and numerical analyses contain the applied methods.
To be published, ENS 2008
Computing the Chernobyl Avalanche
Calculation of the neutron flux, fuel and moderator temperature
transients for Research Reactors
Proceeding of the NESTet, Nuclear Engineering Science and Technology,
energy technology Budapest, Hungary 4 -8 May 2008
ENS NEWS, Issue: 2006/13, Neutron Kinetics of the Chernobyl
Accident
www.euronuclear.org/e-news/e-news-13/neutron-kinetics.htm
| |


