The Devil is in the Details

by Andrew Teller
The recent turmoil affecting the financial places
around the world prompted me to open a report that had been left
unattended on my desk for quite some time. Its title is “Applying
Portfolio Theory to EU Electricity Planning and Policy-MakingI”.
The term portfolio refers of course to shares and portfolio theory
refers to a technique used to reduce risk when investing in shares.
It is well known that the higher the expected return of a share,
the riskier it will be. Portfolio theory shows how to combine
shares of various risks and returns so as to achieve a better
combination of risk and return that if one had invested in only
one type of share. The basic idea behind this technique is that
whenever different shares fluctuate differently with the stock
exchange, this will reduce the overall fluctuation of the portfolio.
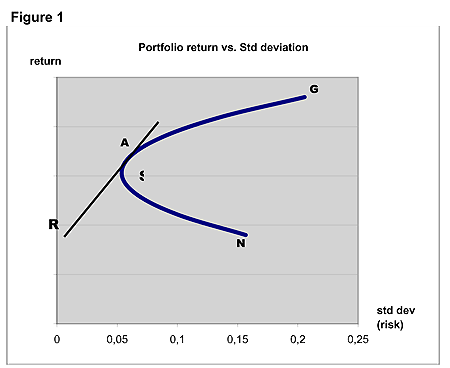
This is illustrated by figure 1 below. Let us first concentrate
on the blue curve. The end point named G is the point where one
has invested 100% in high-risk, high return shares G. The end
point named N represent the situation where all the investment
consists in lower-risk, lower-return shares N. As one moves on
the curve from G to N, the percentage of G shares decreases gradually.
The point S is the leftmost point of the curve, where overall
risk is minimal. The portfolios corresponding to the portion
SAG of the curve are called efficient because the points of SAG
lead to higher returns than the points of SN on the same vertical,
i.e. characterised by same risk. If one brings in the picture
low-return, risk-free securities such as Treasury bonds (point
R), further improvements can be achieved. The combinations of
such securities with the portfolio characterised by point A are
all on line RA. Such combinations can further reduce risk as
can be seen from the chart. In particular, if one considers the
intersection of the horizontal line through point S with the
black line: the risk attached to it is even lower than for point
S although the return achieved is the same. Further details,
including the basic formula underpinning the method, can be found
in the above-mentioned report.

Resorting to portfolio theory when it comes
to electricity planning enables one to take a broader of view
of the issue. Most of the time, the various energy sources available
are assessed only in terms of cost-effectiveness, i.e. in terms
of the € it costs to generate one kWh. Professor Awerbuch
noted that, by inverting this unit cost, one obtains kWh/€,
which is akin to a return. The risk attached to such return consists
of the fluctuations that can affect it and that are generated
in the main by the cost of fuel. Fig 1 can now be re-interpreted
in this new context and the insights of portfolio theory should
be easy to apply to energy if one considers N and G as standing
for nuclear and gas respectively. Can point R, which corresponds
to a zero risk stand for renewables? Yes says the report, because
when it comes to wind and solar energy, the fuel is free and
its cost is therefore not subject to fluctuations. This is why
the authors see in renewables a perfect equivalent to Treasury
bonds and they proceed to draw all the lessons of portfolio theory
to define an efficient energy mix for the EU. The outcome of
this exercise is that one ends up with energy portfolios where
nuclear energy and renewables dominate a small proportion of
gas and coal. The authors repeatedly noted that high proportions
of wind energy cannot be taken for granted due to its interruptible
nature (notes 38, p22, 56 p28 and 76, p38) but they did not take
the step of trying to assess the impact of this constraint on
their conclusions. This is however a serious departure from the
financial portfolio model. After all, Treasury bonds do not provide
their return part of the time only. Furthermore, energy planners
differ from investors in another way: the former also set themselves
the goal of being able to achieve a given peak power with a high
level of confidence. To match this constraint, investors would
have to be able to achieve a peak income at given times during
the investment period, which is obviously not taken into account
by portfolio theory.
Out of interest, I asked myself how this shortcoming
could be overcome and quickly found out that it is far from being
straightforward. The abovementioned constraints do not easily
lend themselves to modelling: the need for continuity of supply
is not easy to express in the return/standard-deviation plane;
the required minimum energy return introduces an absolute value
in a problem where all others are relative. One possible way
consists in noting that in the future, higher proportions of
renewables will require the provision of specific back-up generating
capacity to make up for their low availability. This back-up
would be provided by non-interruptible sources or, perhaps, by
additional wind capacity spread over large areas. In either case,
the expected return will be lower than the one considered in
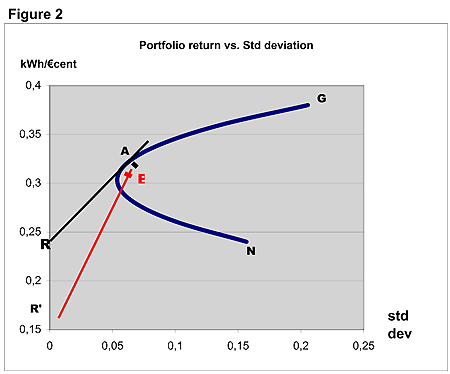
the reportII. The consequences could be illustrated
with the help of Figure 2.

Instead of having line RA, we would be confronted
to something like line R’B. Should the orders of magnitude
represented be correct, the following consequences would follow:
-
The risk reduction one can expect with a return of
renewables equal to R’ is less than what could be obtained
with R as can be easily ascertained by comparing the respective
positions
of the points on lines RA and R’B.
-
Likewise, including a large proportion of wind in
the energy mix would reduce the return of the energy mix
to a noticeably
larger extent than is assumed in the report on the basis
of too optimistic figures for wind generation.
Alternatively, one might consider that the fuel risk borne
by the back-up capacity needed by wind is to be ascribed
to the
latter. Point R would the leave the zero-risk vertical
and move to the areas of positive standard deviation, with an
effect similar
to the move of R to R’.
Does all this mean that the wind option should be abandoned?
Certainly not, but it does mean that overlooking
one single basic fact can seriously alter the conclusions
of an otherwise
rigorous
analysis. The devil is indeed in the details.
I This
report, dated February 2003, was written by the late Prof. Shimon
Awerbuch and co-authored
by Martin Berger. It can be downloaded from www.awerbuch.com
II The figures used
in the report date back to 2000, a time when the small proportion
of wind energy in the overall mix did
not imply specific back-up capacity.
|


